

The Dow Jones Industrial Average (DJIA) has been a cornerstone of the stock market, reflecting economic trends, investor confidence, and long-term growth. Over the past decade, the Dow Jones 10-Year Daily Chart has captured remarkable market movements, showing how the index has nearly doubled from 2016 to 2025.
📈 As of February 7, 2025, the Dow Jones stands at 44,303.40, marking a significant rise from 19,762.60 in 2016. This 124% increase underscores the market’s ability to absorb capital and push higher, despite economic uncertainties.
In 2016 alone, the DJIA climbed 14%, fueled by:
✅ Stronger corporate earnings
✅ Economic optimism post-election
✅ Federal Reserve’s monetary policies
Since then, the market has navigated through major events like the COVID-19 crash in 2020, a bull run in 2021, and inflation-driven corrections in 2022. However, by 2023-2025, the index rebounded, setting new all-time highs above 44,000.
This article will break down:
📊 Stock market trends from 2016 to 2025
📌 Historical Dow Jones annual returns
🔍 Key questions like “What is the Dow Jones average today?” & “What did the Dow close at 4 years ago today?”
🚀 Let’s dive into the numbers, trends, and future outlook!
Dow Jones 10-Year Daily Chart (2016–2025)
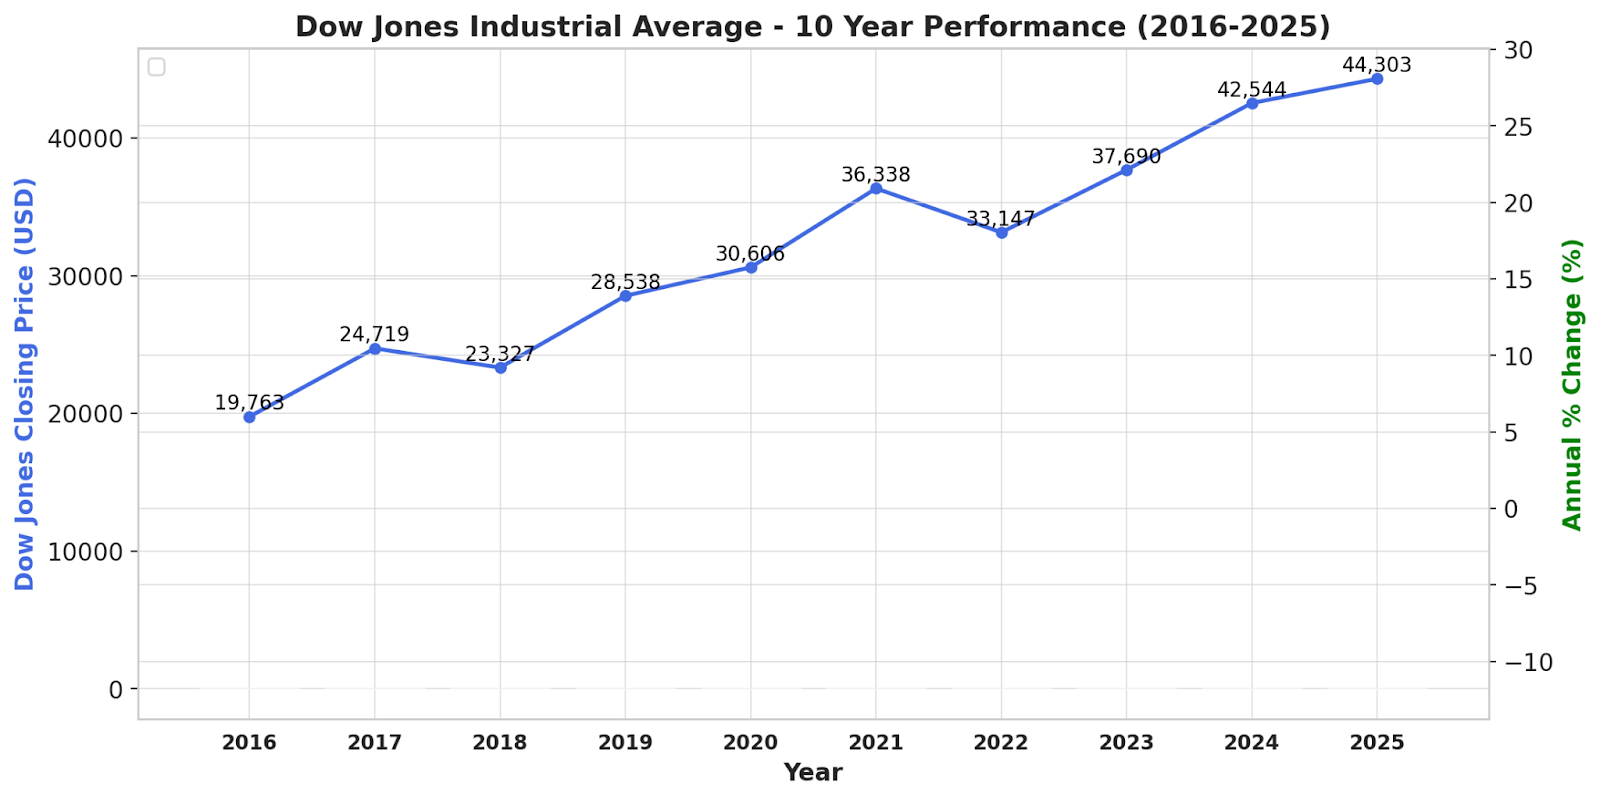
📈 Key Market Trends from 2016 to 2025:
- 2016: The DJIA climbed 14%, closing at 19,762.60.
- 2018-2019: The market soaked up capital, reaching 28,538.44 by 2019.
- 2020: A sharp drop due to the COVID-19 crash, but recovery followed.
- 2022: A market correction with an 8.78% decline, reflecting inflation concerns.
- 2023-2025: The DJIA rebounded to 44,303.40 by 2025, nearly doubling since 2016.
📊 Dow Jones 10-Year Daily Chart: Yearly Returns
| Year | Average Closing Price | Year Open | Year High | Year Low | Year Close | Annual % Change |
| 2025 | 43,735.57 | 42,392.27 | 44,882.13 | 41,938.45 | 44,303.40 | 4.13% |
| 2024 | 40,323.13 | 37,715.04 | 45,014.04 | 37,266.67 | 42,544.22 | 12.88% |
| 2023 | 34,121.54 | 33,136.37 | 37,710.10 | 31,819.14 | 37,689.54 | 13.70% |
| 2022 | 32,898.34 | 36,585.06 | 36,799.65 | 28,725.51 | 33,147.25 | -8.78% |
| 2021 | 34,055.29 | 30,223.89 | 36,488.63 | 29,982.62 | 36,338.30 | 18.73% |
| 2020 | 26,890.67 | 28,868.80 | 30,606.48 | 18,591.93 | 30,606.48 | 7.25% |
| 2019 | 26,379.59 | 23,346.24 | 28,645.26 | 22,686.22 | 28,538.44 | 22.34% |
| 2018 | 25,046.86 | 24,824.01 | 26,828.39 | 21,792.20 | 23,327.46 | -5.63% |
| 2017 | 21,750.20 | 19,881.76 | 24,837.51 | 19,732.40 | 24,719.22 | 25.08% |
| 2016 | 17,927.11 | 17,148.94 | 19,974.62 | 15,660.18 | 19,762.60 | 13.42% |
🔗 View the full historical chart on Macrotrends
Current Dow Jones Performance & Key Market Factors
What is the Dow Jones average at today?
To check the latest Dow Jones average, visit:
➡️ Live DJIA Data on TradingView
➡️ IndexDJX: .DJI on Yahoo Finance
What did the Dow close at 4 years ago today?
- As of 4 years ago (February 2021), the Dow was trading around 31,000-32,000 points.
- You can check exact historical closing prices on Yahoo Finance’s IndexDJX: .DJI page.
Stock Market Trends & Dow Jones Growth Factors
How the Dow Absorbed Capital and Climbed in 2016
The Dow climbed 14% in 2016, boosted by:
- Strong earnings growth
- Optimism over U.S. tax policies
- Increased capital inflows from institutional investors
Market Resilience from 2020 to 2025
- COVID-19 crash (2020): The Dow dropped but recovered strongly.
- Inflation and Rate Hikes (2022): The index declined, but long-term growth continued.
- Bull Market (2023-2025): The Dow nearly doubled compared to 2016, surpassing 44,000 in 2025.
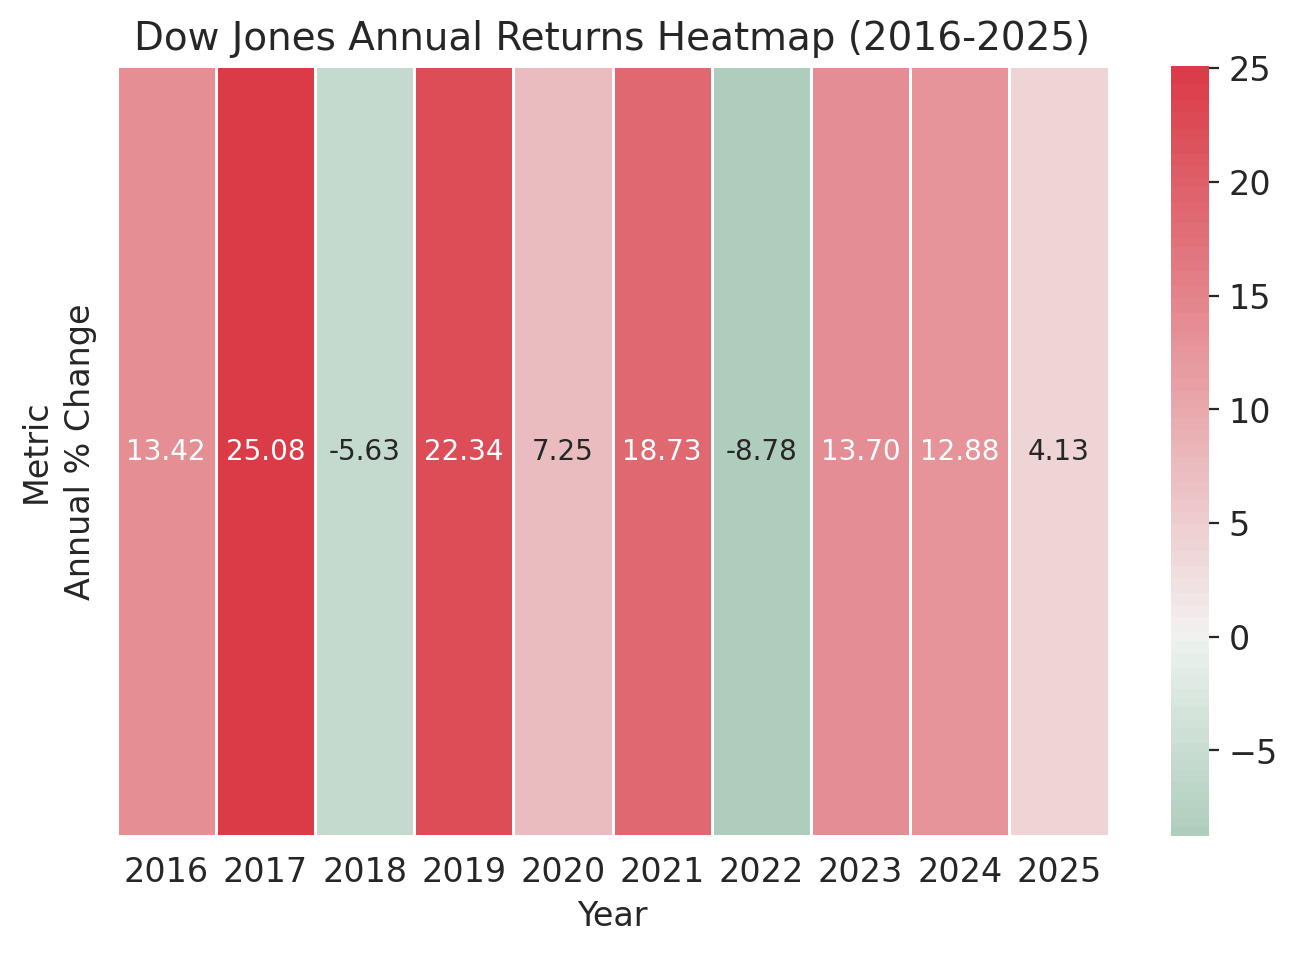
Heatmap: Dow Jones Annual Returns (2016–2025)
FAQs About Dow Jones Performance
What is the 5-year average return on the Dow?
As of 2025, the 5-year average annual return is 10.99%, reflecting long-term market growth.
What is the Dow Jones average in 2024?
- The average closing price in 2024 was 40,323.13.
- The year closed at 42,544.22, marking a 12.88% gain.
What was the Dow Jones in 2016?
- The 2016 average closing price was 17,927.11.
- It opened at 17,148.94 and closed at 19,762.60, marking a 13.42% gain.
Final Thoughts: Dow Jones’ Long-Term Growth
The Dow Jones 10-Year Daily Chart illustrates how the index has consistently absorbed capital and climbed higher. From a 14% rise in 2016 to nearly doubling by 2025, the DJIA remains a strong indicator of market resilience.
Investors tracking stock market trends from 2016 to 2025 can use these insights for future investment decisions.